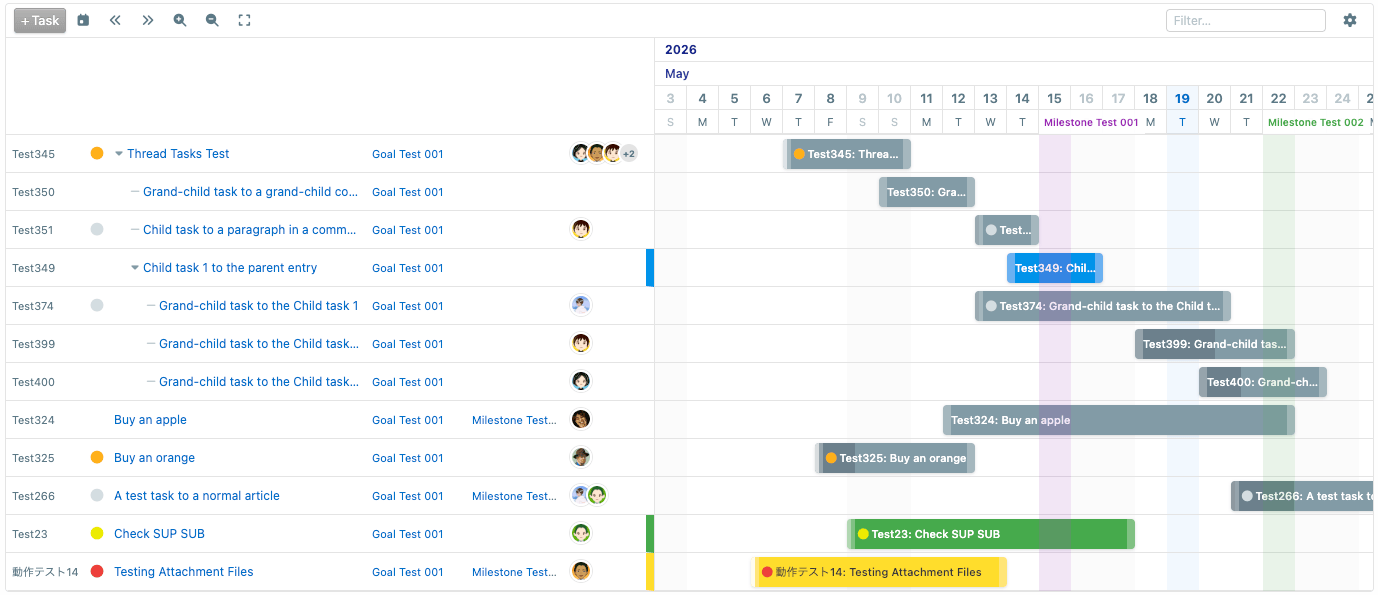
This new Gantt Chart plug-in (com.
| Feature | Description |
|---|---|
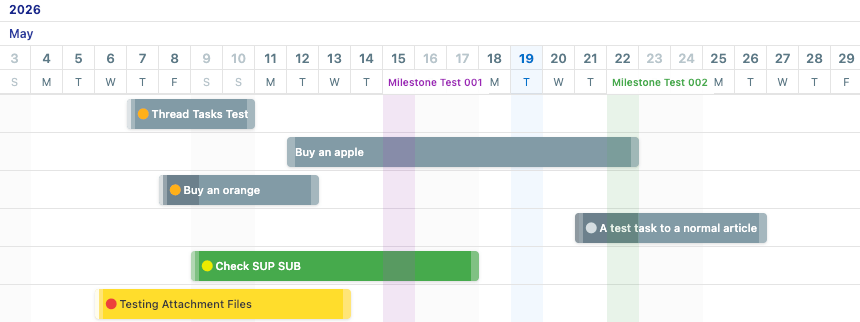
| Task bars | Each task is drawn as a colored bar spanning its start and due dates. |
| Priority colors | Bars and left-panel icons are tinted by task priority. |
| Milestone markers | Milestone due dates appear as vertical lines across the chart. |
| Tree structure | Parent tasks expand and collapse to reveal child tasks, with smooth animation. |
| Zoom levels | Switch between Hours, Days, Weeks, and Months views. |
| Progress fill | Bars optionally show a fill based on estimated hours or completed child tasks. |
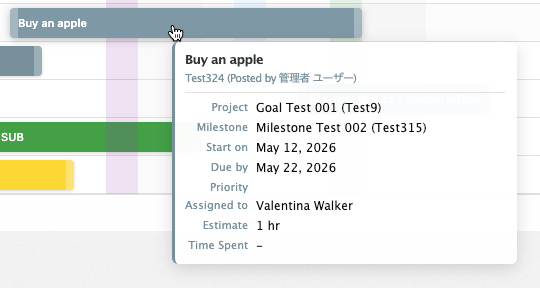
| Hover tooltip | Hovering over a bar shows a summary card with dates, assignees, priority, and more. |
| Bar drag | Authorized users can drag bars left/ |
| Text filter | Type in the filter box to instantly narrow rows by title. |
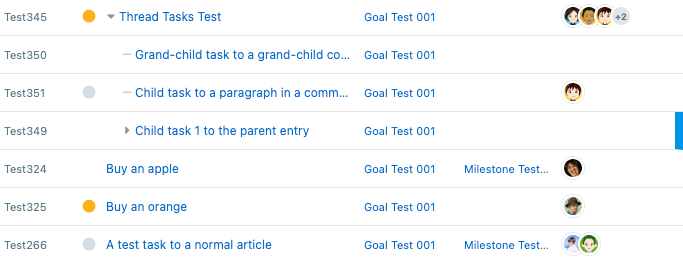
| Flexible left panel | The left panel can be resized by dragging the divider; all columns scroll horizontally when the panel is narrow. |
| Automatic ID column | The Entry ID column width adjusts automatically to fit the longest ID in the current data set. |
| Fullscreen mode | Open the chart in a new browser tab for a larger workspace. |
| Control | Action |
|---|---|
| Scroll to today (calendar icon) | Pans the chart so today’s date is centred in view. |
| Extend to past (double-left arrow) | Adds columns to the left edge of the grid. |
| Extend to future (double-right arrow) | Adds columns to the right edge of the grid. |
| Zoom in (magnifier +) | Switches to a finer time scale (e. |
| Zoom out (magnifier −) | Switches to a coarser time scale (e. |
| Fullscreen (expand icon) | Opens the chart in a new browser tab. |
| Filter box | Filters visible rows by task title (case-insensitive, updates live). |
| Settings (gear icon) | Opens the in-chart settings panel. |
+2) appears when more assignees are present| Setting | Options | Description |
|---|---|---|
| Sort by | List order, Due date, Start date, Priority, Status | Determines the order in which rows are displayed. |
| Order | Ascending, Descending | Direction of the sort. |
| Setting | Default | Description |
|---|---|---|
| Show completed tasks | Off | When checked, completed tasks are included in the chart. |
| Task grouping | On | Groups child tasks under their parent with tree indentation. |
| Priorities | On | Shows the colored priority circle in the ID column and on bars. |
| Assignee avatars | Off | Shows assignee profile photos in the left panel. |
| Progress | None | Draws a progress fill on each bar — choose None, By hours (estimated vs. actual), or By child tasks (ratio of completed children). |
| Projects | Off | Shows the associated project name as a column in the left panel. |
| Milestones | Off | Shows the associated milestone name as a column in the left panel. |
| Setting | Default | Description |
|---|---|---|
| Use Completion Date for Completed Tasks | No | When Yes, completed tasks use their completion date as the bar’s right edge instead of the due date. |
| Infer Missing Due Date | Yes | When Yes, a task with no due date falls back to its milestone’s due date, then the project’s due date, then today plus the offset below. |
| Fallback Due Date Offset (Days) | 0 | Number of days added to today to determine a bar’s end when no due date can be found via the inference chain above. |
| Show Tasks Without a Due Date | Yes | When Yes, tasks with no determinable end date are still rendered on the chart. |
| Enable Bar Dragging | Yes | When Yes, authorized users can drag bars to reschedule tasks. |
| Drag-Enabled Group | Everyone | Only members of this group can drag bars. Edit permission on the task is also required. |
| Setting | Default | Description |
|---|---|---|
| Default Zoom Level | Days | The zoom level shown when the chart is first opened. |
| Minimum Zoom Level | Days | The finest zoom level a user can select; zoom-in is blocked beyond this level. |
| Maximum Zoom Level | Months | The coarsest zoom level a user can select; zoom-out is blocked beyond this level. |
| Automatically Scroll to Today | Yes | When Yes, the chart scrolls to today’s date when opened. |
| Task Bar Label | Entry Title | What text to display on each bar — Entry Title, Entry ID, Entry ID + Entry Title, or None. |
| Grid Lookahead (Hours) | 0 | Extra hours added to the right edge of the grid when zoomed to Hours. |
| Grid Lookahead (Days) | 0 | Extra days added to the right edge of the grid when zoomed to Days. |
| Grid Lookahead (Weeks) | 0 | Extra weeks added to the right edge of the grid when zoomed to Weeks. |
| Grid Lookahead (Months) | 0 | Extra months added to the right edge of the grid when zoomed to Months. |
en_example.png
toolbar.png
leftpanel.png
bar_area.png
hint_dialog.png