This plugin, Schedule Aggregation or Events Aggregation plug-in, automatically calculates how many hours people worked for what category, based on the start and the end dates/times of the event entries (schedule entries), in the specified time period. The results are summarized and displayed with the easy-looking tables and charts.
In TeamPage, you can post a schedule as "an event entry" and share it with team members. Each schedule information can be checked by looking at the start/end dates and times in the posted event entry, but there is no aggregation capability of "who is spending his/her time for which work".
For example, managers may want to know how much his/her subordinates work on what tasks in their division. The subordinates may want to know how productive they are.
This plug-in meets these needs.
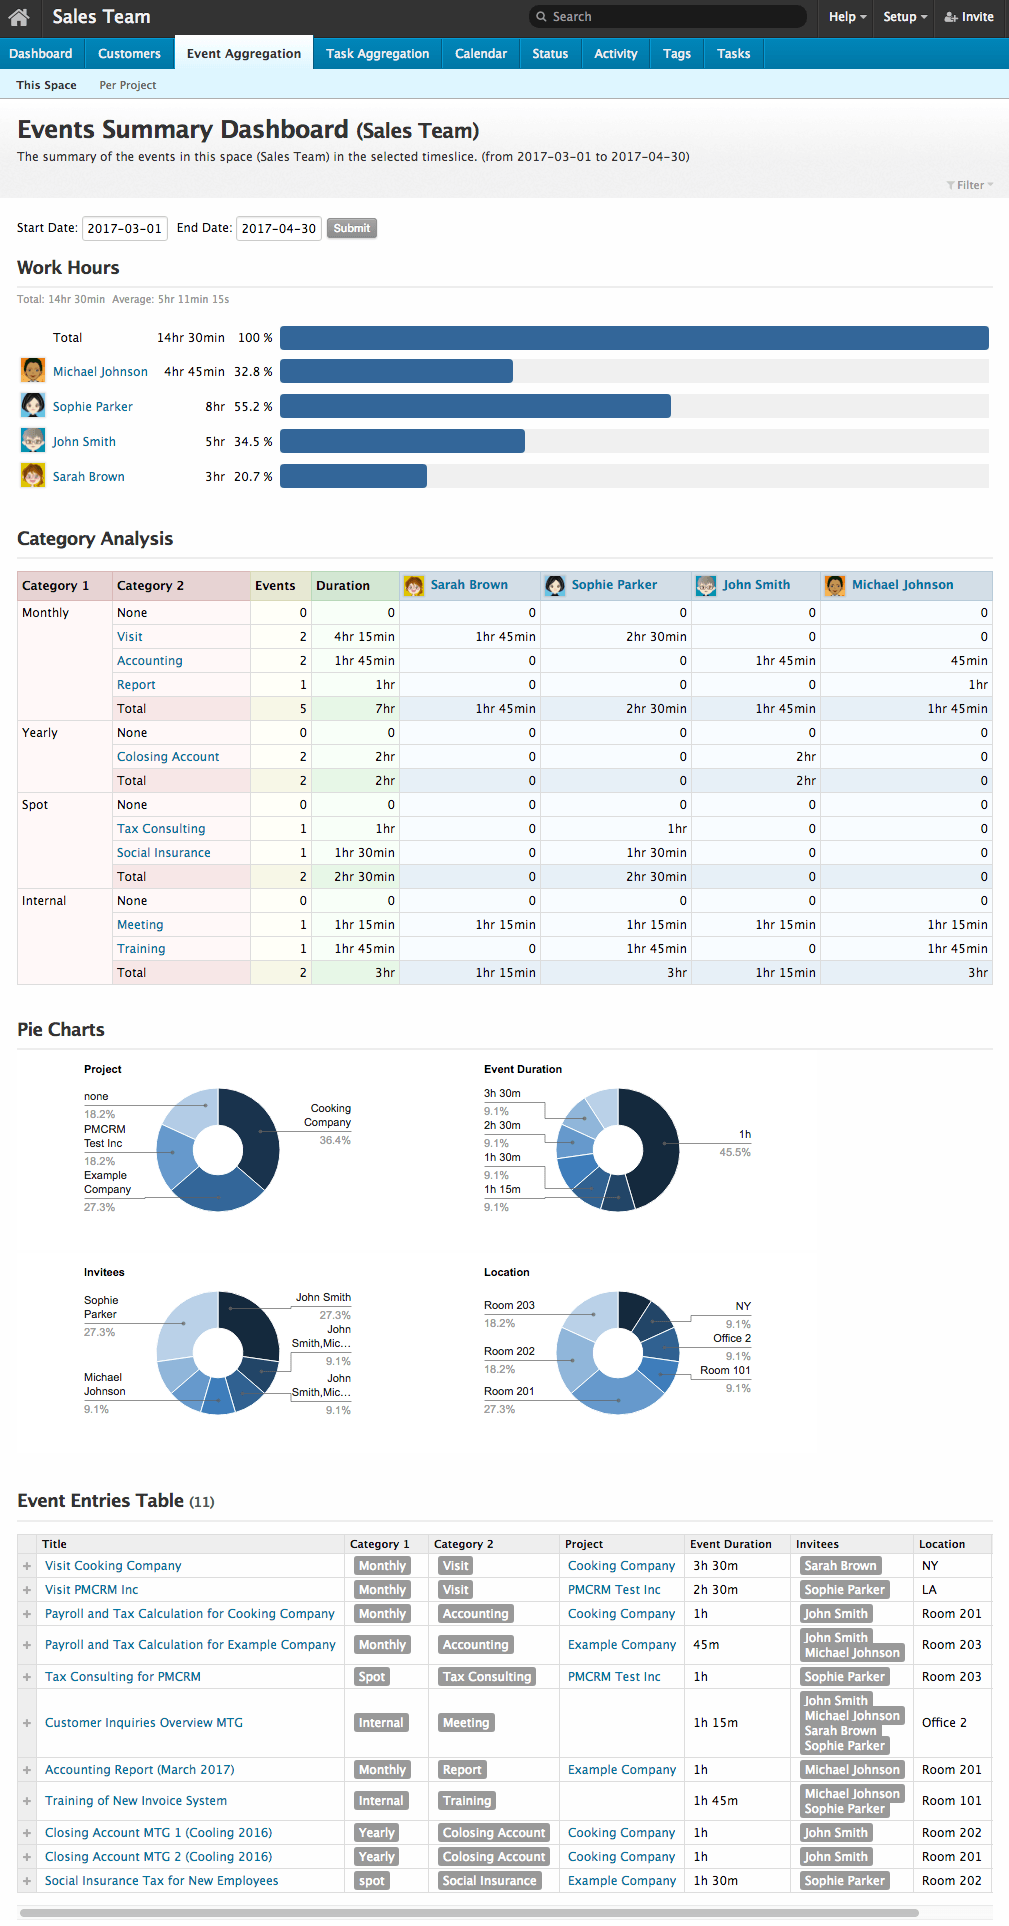
Aggregation Dashboard
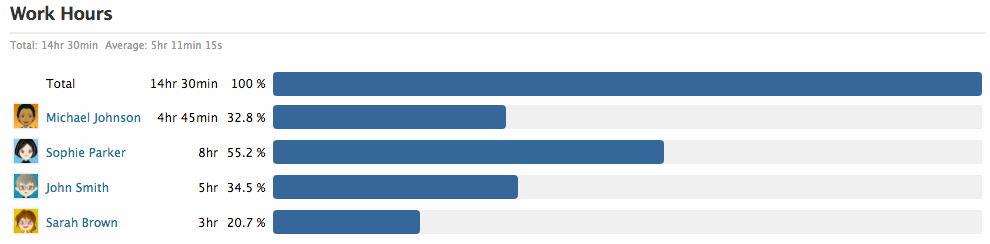
In the Dashboard view includes the following 4 sections.
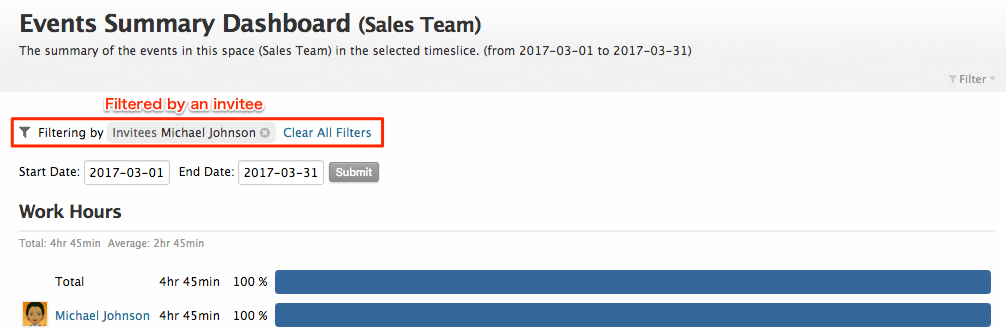
The percentages and the bar charts show the ratio to the whole spent time.
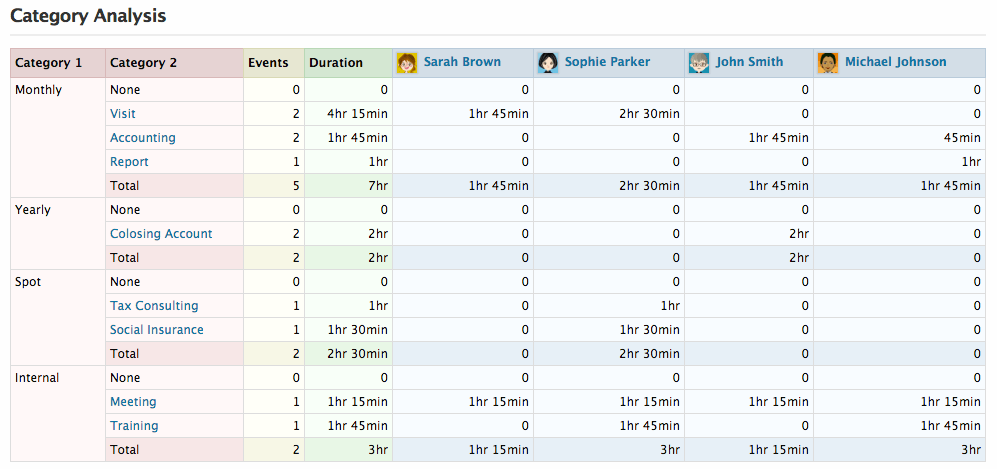
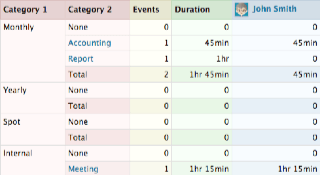
Category and time analysis
The categories are tags. Which tags should be to be displayed in the table is defined by admin. If a tag has a sub-level, e.g. monthly:Visit (1st level = monthly, 2nd level = Visit), the tag should be separated to "Category 1" and "Category 2".
Pie charts
Based on information such as the locations, participants, number of hours, related customers, etc., the section displays actuals and trends as pie charts.
The pie charts to be displayed in this section can be selected by admin.
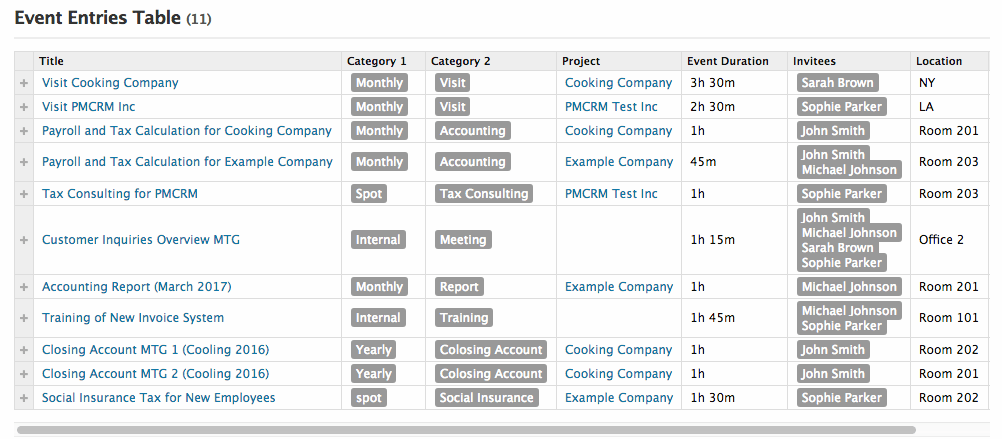
Section table for the event entries
This section displays event entries in the specified time period. It is convenient because it allows you to expand each entry with a single click, add comments, and edit it.
Automatic calculation
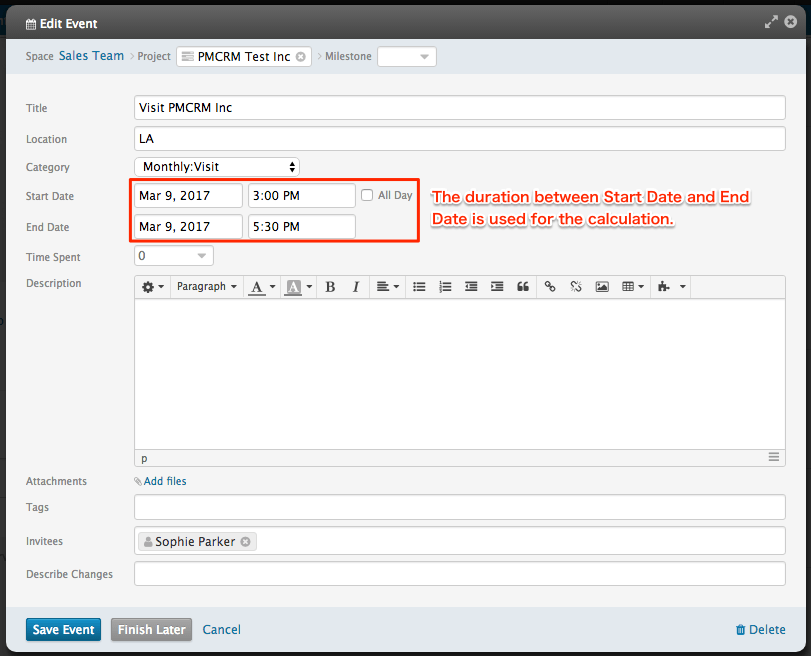
The spent time used for the aggregation is automatically calculated from the start and end date/time of the event entry.
If the event entry is set to be "all day", there is no particular start/end dates and times. In this case, it should be calculated by a predetermined number of hours, 8 hours as default, by admin.
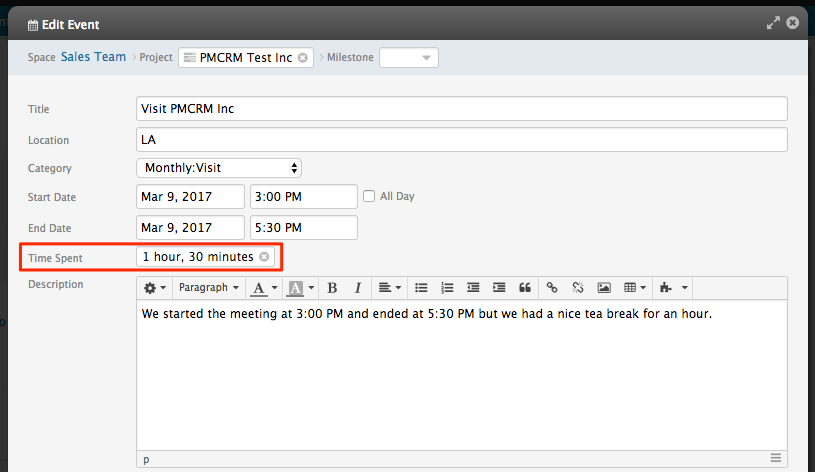
Manual input of hours
In some special cases, the duration between the start and end date/time may be different from the actual spent time. For example, "the start of the event is 11AM and I finished it at 2PM. The duration is 3 hours, but I took a lunch break for an hour. So the actual time I spent for this event was 2 hours."
You can narrow down the information displayed on the dashboard under various conditions such as invitees, locations, related projects, tags (categories), contributors, posting space etc.
Learn more
This plug-in is a charged option. Please feel free to contact us for the pricing, demonstrations, and any other detailed information.
Related
JPBO14036 is the document of the prototype version of this plug-in, which name was "Events Summary Dashboard".