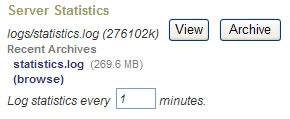
See Support668 for instructions on how to graph the server's memory usage.
Here is an example of the information Traction stores. This type of block is written to the logfile at the above interval.
You can press the Record button to immediately write the current statistics to the logfile.
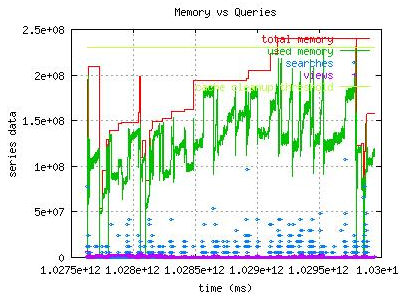
The Knowledge Base article How can I graph server statistics provides a gnuplot script you can use to graph the statics in a form like:
With a Unix computer, you can also use MRTG to create statistics graphs like these, which were created using a cron job, curl, and MRTG.
Please contact support@tractionsoftware.
Attachments:
image507.jpg
image506.jpg
image508.jpg
image596.gif
Article: Doc259 (permalink)
Date: March 22, 2008; 4:18:56 PM Eastern Daylight Time
Author Name: Documentation Importer
Author ID: importer
Date: March 22, 2008; 4:18:56 PM Eastern Daylight Time
Author Name: Documentation Importer
Author ID: importer